
← Learn
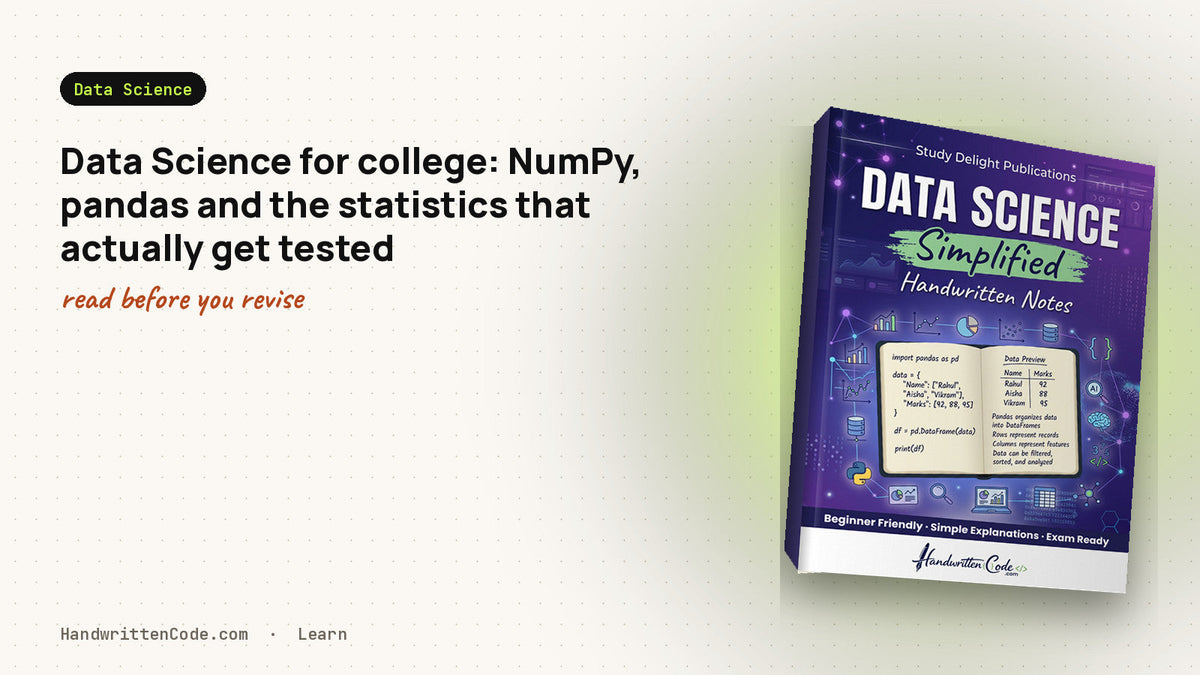
Data Science for college: NumPy, pandas and the statistics that actually get tested
The data-science elective is 40% statistics, 40% Python libraries, 20% ML vocabulary. Here is each part in exam order.
HCHandwrittenCode team
Study Delight Publications, Delhi
Study Delight Publications, Delhi
"Data Science" as a college subject is narrower than the internet makes it look. The paper is built from three parts — statistics, the Python data stack, and a vocabulary of machine learning — and each is very learnable in a week.
Part 1 — Statistics (40%)
- Descriptive — mean, median, mode, range, variance, standard deviation, quartiles, IQR. Do one numerical of each by hand.
- Distributions — normal, binomial, Poisson; the 68-95-99.7 rule.
- Correlation and regression — Pearson's r, the least-squares line y = a + bx, interpreting the slope. A ten-mark numerical most years.
- Hypothesis testing — null vs alternative, p-value, t-test and chi-square in words.
- Sampling — random, stratified, systematic; population vs sample.
Part 2 — The Python data stack (40%)
import pandas as pd
df = pd.read_csv("students.csv")
df["pass"] = df["marks"] >= 40
print(df.groupby("dept")["marks"].mean().round(1))
print(df[df["pass"]].sort_values("marks", ascending=False).head())-
NumPy — arrays, shape, indexing, broadcasting,
mean / std / reshape, vectorised operations vs loops. -
pandas — Series, DataFrame,
read_csv, selection withloc / iloc, filtering,groupby, handling missing values (isna, fillna, dropna), merge/join. - Matplotlib / Seaborn — line, bar, histogram, scatter, box plot; which chart answers which question.
- Data cleaning — duplicates, outliers, type conversion, normalisation vs standardisation.
Part 3 — Machine learning vocabulary (20%)
- Supervised vs unsupervised vs reinforcement — with one example each
- Regression vs classification; linear regression, logistic regression, decision tree, k-NN, k-means — know what each is for, not the maths
- Train/test split, overfitting vs underfitting, cross-validation
- Metrics — accuracy, precision, recall, F1, confusion matrix (draw it), RMSE for regression
- The data-science lifecycle — collect → clean → explore → model → evaluate → deploy
How to revise
Two days on statistics numericals, two days on pandas (write code, not notes), one day on charts, one day on ML vocabulary with the confusion matrix, and one day on a past paper. The practical is almost always "load a CSV, clean it, group it, plot it" — the code above is the template.
The Data Science Simplified Handwritten Notes (116 pages) show every pandas operation with the resulting table printed beside it, and every chart next to the code that drew it.